
Any secondary school teacher will know the apprehension with which you approach results day in August, of the traffic light spreadsheets and the painstaking analysis that follows the headline excitement. GCSE examination results are the measure used to hold schools and teachers to account, hence much is at stake on that Thursday in late summer.
Rather than just use the raw results, for the last 25 years the government has aimed to make the process fairer by examining the levels of progress a pupil has made whilst in the school (Kelly & Downey, 2010; Leckie & Goldstein, 2017). The assumption is that this is a fairer test of the school’s performance as a pupil making 3 levels of progress at a lower level, is awarded the same as a pupil making 3 levels of progress at a higher level. It is these progress levels that are tracked meticulously through a pupil’s time at school and ultimately published in the annual league tables (Leckie & Goldstein, 2009), used by parents and Ofsted alike to make a judgement on a school’s performance.
Progess 8
In 2016, the government introduced ‘Attainment’ and ‘Progress 8’ as an accountability measure (Department for Education [DfE], 2018). Attainment 8 showed the average attainment of all pupils in the school in their best 8 subjects (Ark, 2016). Progress 8, is a little more complex as it examines the progress pupils make based on their key stage 2 levels. However, not all subjects are equally weighted and not all subjects are counted, they are divided into categories (Ark, 2016):
Category A: 2 double-weighted subjects
- Maths
- English Language/ Literature
Points are doubled for these subjects, however, for English to be doubled, both language and literature must have been sat, but only one will be double-weighted.
Category B: 3 EBBAC subjects
- Sciences
- Computer Science
- Geography
- History
- Languages
The best 3 will be chosen for this category.
Category C: 3 other subjects
3 of the best other subjects including:
- English GCSE not counted for category A
- Ebbac subjects not counted for category B
- Art subjects such as music, dance, drama and art
- Vocational subjects
Success is heavily weighted towards academic subjects, which is a disadvantage to lower achieving pupils more likely to sit more vocational qualifications (Burges & Thompson, 2013). Ofsted (2019) have recognised the over reliance on academic subjects and recommended a more diverse curriculum, however this is difficult when the reported measure of accountability is still biased towards academia.
Should we adjust for pupil and school background?
The government argues that Progress 8 is a fair accountability measure as it takes into account the Key Stage 2 scores rather than simple attainment, assuming that all schools, with pupils from all backgrounds will make progress at a similar trajectory. However, studies demonstrate the importance of demographic background in predicting school attainment (Teddlie & Reynolds, 2000; Reynolds et al., 2014). It has also been shown that race, gender and background can have an impact, with trends revealing that working class white boys with special educational needs, make the least amount of progress (EPI, 2017). Many therefore argue that to not adjust scores accordingly is unfair (Goldstein, 1997; OECD, 2008; Raudenbush & Willms, 1995; Reynolds et al., 2014; Teddlie & Reynolds, 2000), the effects of which are multitude:
- The effectiveness of schools in deprived areas goes unacknowledged
- Schools in advantaged areas are able to ‘coast’ without identification
- Schools are incentivised to not admit lower achieving pupils or it can lead to expulsion of some of the most vulnerable students so they don’t damage performance results (Timpson, 2019)
- A narrowed curriculum further disadvantages less able students.
The government have argued that adjusting performance measures according to socio-economic background simply reaffirms poor performance by lowering expectations which is why, in 2010, they withdrew measures to adjust according to background, arguing that it was ‘wrong in principle’ (DfE, 2010, p. 68, Perry, 2016).

Methods
The research looked at the Progress 8 scores of all state maintained secondary schools (Leckie & Goldstein, 2019). Information from the National Pupil Database was used to recreate the raw Attainment 8 data and Key Stage 2 scores. This information was then used to explore a range of background factors including:
Pupil characteristics
- Age (month of birth)
- Gender
- Background
- Ethnicity
- English as an additional language
- Special educational needs and disabilities
- Free school meal eligibility.
School characteristics
- Region
- Type
- Admissions policy
- Age range
- Gender
- Religious affiliation
- Deprivation of the school neighbourhood.
The information was correlated to examine the relationship between Progress 8 scores and pupil background characteristics, before exploring what the scores would look like if adjusted accordingly.
Results
The study revealed a number of factors that influenced the amount of progress made within secondary school:
- Younger pupils with an August birthday made 0.19 grade per subject more progress than pupils with a September birthday due to levelling out of maturity levels
- Girls made 0.26 grade more progress per subject than boys widening the gender gap that already exists at the end of key stage 2
- Ethnicity of pupils had an impact of the progress made per subject
- Chinese + 0.70
- Other Asian background +0.51
- Indian +0.37
- Bangladeshi +0.35
- Pakistani +0.16
- White Irish +0.10
- White British -0.08
- Black Caribbean -0.11
- Gypsy/Roma -0.64
- Traveller (Irish) -1.04
- Pupils with special educational needs made 0.38 grade less progress per subject, those with a statement, 0.51 less
- Pupils on free school meals made 0.32 grades less progress per subject
- Pupils in the least deprived areas made 0.19 grades more progress than expected as opposed to pupils in the most deprived areas who made 0.27 less progress.
However, when adjusting for background, a different picture starts to emerge:
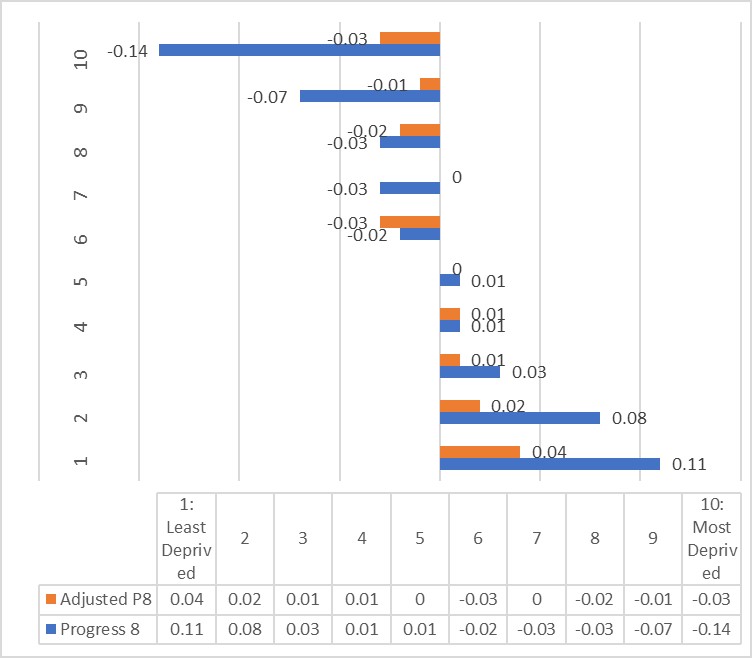
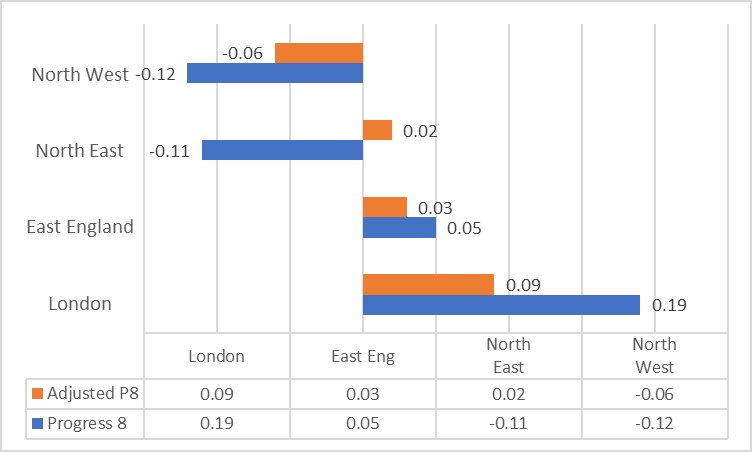
As can be seen from Table 1, schools in the most affluent areas do less well and those with the highest levels of poverty perform significantly better. When examining regions (Table 2), a similar pattern emerges, areas that are traditionally working class, such as the North East and North West perform much better under adjusted scores whilst more affluent parts of England such as London and the East of England generally show less progress than originally reported. The high ethnicity rate in London also accounts for their initial high performance as this is known to positively influence performance factors.
Alongside higher levels of poverty are increased levels of health inequalities, both physical and mental, as first reported by the 1980 Black Report (Black, Morris, Smith, & Townsend, 1982) and confirmed by later reports (Marmot, 2010; Whitehead, 1988), with Public Health England reiterating that there is not just a health divide, but also an educational one with children and young people from deprived areas having poorer outcomes (H.M. Government, 2017). This is especially significant when considering attendance levels, something that will have a significant impact on progress. It also highlights the importance of having time to address both physical and mental health concerns within less advantaged areas, something not currently possible due to the need to meet the demands of progress 8.

Conclusions
Adjusting progress 8 scores for school and pupil characteristics dramatically changes how a school is deemed to be performing. Examination of the data revealed that a third of so called ‘underperforming’ schools would no longer be within this category if scores were adjusted to reflect the pupil background.
The number of pupils on free school meals, as an indicator of disadvantage, was found to have the biggest influence on reducing progress and ethnicity found to have the highest positive impact.
By ignoring these factors, schools that serve such pupils are effectively punished or rewarded for the impact of societal factors, it is therefore recommended that adjusted progress 8 scores be published alongside progress 8 so that fairer conclusions of school accountability can be drawn.

Strengths and limitations
There is general concern about the use of any measures that use high stakes testing to evaluate school accountability expressed by both academics (Amrein-Beardsley, 2014; Foley & Goldstein, 2012; Perry, 2016) and teachers (National Association for Head Teachers, 2018). Such measures:
- Fail to demonstrate pupil engagement, curiosity and independent learning
- Result in teaching to the test
- Lead to narrowing of the curriculum to focus on ‘tested’ subjects
- Increase pupil and teacher stress.
Regardless of whether scores are adjusted or not, these issues are not addressed. There is little research to confirm the link between improved pupil learning and test measured school accountability (NFER, 2018).

Implications for practice
- Government use of test based school accountability can not be supported by the data or research.
- Foley and Goldstein, 2012 argue that it should at best be used as a ‘screening device’ to indicate the need for further investigation.
- However, the authors suggest that such data should only be used as a tool for school self-evaluation, to help identify groups of pupils that require more support.

Conflicts of interest
None reported.
Links
Primary paper
Leckie, G., & Goldstein, H. (2019). The importance of adjusting for pupil background in school value‐added models: A study of progress 8 and school accountability in England. British Educational Research Journal, 45(3), 518-537. doi:10.1002/berj.3511
Other references
Ark. (2016). Understanding Attainment 8 and Progress 8 – new GCSE measures.
Amrein-Beardsley, A. (2014). Rethinking value-added models in education: Critical perspectives on tests and assessment-based accountability (Abingdon, UK: Routledge).
Black, D, Sir., Morris, J., Smith, C., & Townsend, P. (1982). Inequalities in health: The Black report. In P. Townsend., M. Whitehead., & N. Davidson (Ed.), (1992). Inequalities in health (pp. 44-129). London, United Kingdom: Penguin Books.
Burgess, S. & Thomson, D. (2013). Key Stage 4 accountability: Progress measure and intervention trigger.
Education Policy Institute. (2017). The introduction of Progress 8.
Department for Education. (2010). The importance of teaching: The Schools White Paper 2010.
Department for Education. (2018). Secondary accountability measures: Guide for maintained secondary schools, academies and free schools.
Foley, B. & Goldstein, H. (2012). Measuring success: League tables in the public sector.
Goldstein, H. (1997). Methods in school effectiveness research. School Effectiveness and School Improvement, 8(4), 369-395. doi:10.1080/0924345970080401
H.M. Government. (2017). Health profile for England: Chapter 6 social determinants of health.
Kelly, A. & Downey, C. (2010). Using effectiveness data for school improvement: Developing and utilising metrics. Abingdon, UK: Routledge.
Leckie, G., & Goldstein, H. (2009). The limitations of using school league tables to inform school choice. Journal of the Royal Statistical Society. Series A (Statistics in Society), 172(4), 835-851. doi:10.1111/j.1467-985X.2009.00597.x
Leckie, G., & Goldstein, H. (2017). The evolution of school league tables in England 1992–2016: ‘Contextual value‐added’, ‘expected progress’ and ‘progress 8’. British Educational Research Journal, 43(2), 193-212. doi:10.1002/berj.3264
Marmot, M. (2010). Fair society, healthy lives: the Marmot review.
National Association of Head Teachers. (2018). Improving school accountability.
National Foundation for Educational Research. (2018) What impact does accountability have on curriculum, standards and engagement in education? A literature review.
Organisation for Economic Cooperation and Development. (2008). Measuring Improvements in Learning Outcomes: Best Practices to Assess the Value-Added of Schools. Paris, France: OECD Publishing.
Ofsted. (2019). The education inspection framework.
Perry, T. (2016). English Value‐Added measures: Examining the limitations of school performance measurement. British Educational Research Journal, 42(6), 1056-1080. doi:10.1002/berj.3247
Raudenbush, S. W. & Willms, J. (1995) The estimation of school effects. Journal of Educational and Behavioral Statistics, 20, 307–335.
Reynolds, D., Sammons, P., De Fraine, B., Van Damme, J., Townsend, T., Teddlie, C. et al. (2014) Educational effectiveness research (EER): A state-of-the-art review. School Effectiveness and School Improvement, 25, 197–230.
Teddlie, C. & Reynolds, D. (2000). The international handbook of school effectiveness research. London, UK: Psychology Press.
Whitehead, M. (1988). The health divide. In P. Townsend., M. Whitehead., & N. Davidson (Ed.). (1992). Inequalities in health. London, United Kingdom: Penguin Books.
Photo credits
- Photo by Chris Liverani on Unsplash
- Photo by Aaron Burden on Unsplash
- Photo by Sam Balye on Unsplash
- Photo by Lacie Slezak on Unsplash
- Photo by Kimberly Farmer on Unsplash
- Photo by Banter Snaps on Unsplash