
Papa Elf sent me a paper (Kambeitz et al, 2015) looking at a meta-analysis of a technique involving brain imaging to try and successfully classify study participants as meeting the criteria for schizophrenia or not.
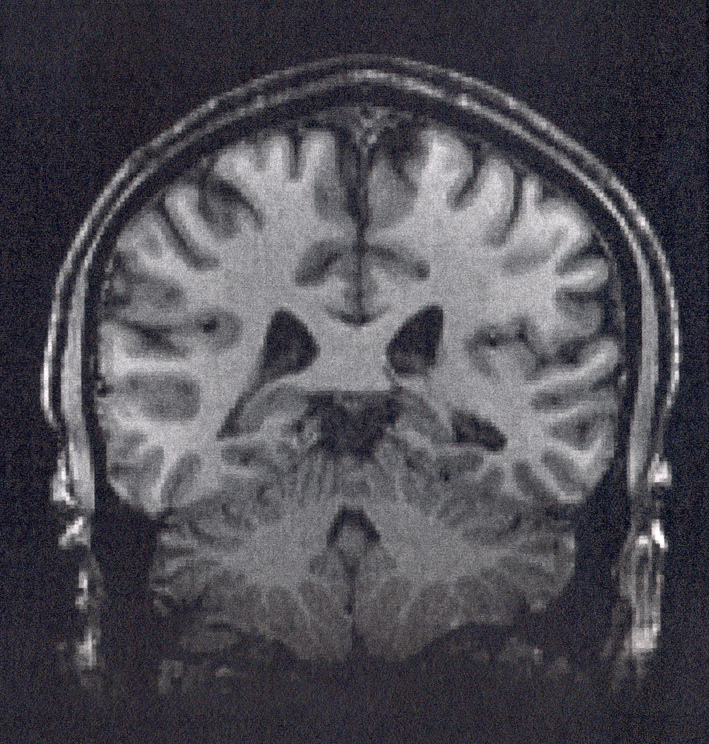
The study uses a type of diagnostic screening tool using brain imaging combined with “multi-variate pattern recognition” which usually includes a “machine learning algorithm” to improve predictive accuracy. This involves looking at interconnected regions of the brain for patterns that tend to be associated with the diagnosis of schizophrenia in the participants in the study, which differentiates them from participants who did not meet the criteria. If a machine learning algorithm program is used, this will keep trying to improve its’ performance by successfully classifying the subjects.
It’s important to remember that these changes in structure are not necessarily the cause of schizophrenia, but may be the result of a process (not necessarily biological) leading to a diagnosis of schizophrenia.
This is a meta-analysis looking at the effectiveness of a diagnostic screening tool for schizophrenia using multivariate pattern recognition techniques on brain images. This is part of the largely unsuccessful quest for clinically useful biomarkers in psychiatry for “functional” disorders (i.e. no obvious “organic” cause) like schizophrenia.
Fortunately for me, the EBMH Journal recently published an article about how to appraise a meta-analysis of diagnostic screening tools, so I have used this approach to help write my blog (Takwoingi et al, 2015).
Methods
I will quote the paper directly as to which studies are included:
To be included in the meta-analysis a paper needed to report results of a neuroimaging-based multivariate classification model separating patients with schizophrenia from HC {Healthy Controls}. We included all available multivariate approaches such as support-vector machines, random forests, discriminant analysis, logistic regression, neural networks, as well as combinations thereof.
There is also a further condition that results must be expressed in a way to allow calculation of “true positives (TP), true negatives (TN), false positives (FP), and false negatives (FN)” (or the authors had responded to requests for this data).
Reasonably comprehensive search strategies were used and the quality of the studies was assessed using a reasonably established technique. Data extraction was done by two researchers separately and any disagreements resolved using a conference consensus. A bivariate model with random effects was used to analyse the statistics and an appropriate statistics package was used (Takwoingi et al, 2015). Studies were grouped according to the type of brain imaging used and combined for an overall result.
Studies from 1991-2013 were used, but crucially little information in the paper was given as to which diagnostic criteria were used for schizophrenia (I suspect DSM-IV for the majority of studies, but this is just an informed guess on my part).
Secondary analysis looked at various patient characteristics to see if they influenced sensitivity or specificity of the tests such as age, gender, severity of symptoms, first episode vs chronic schizophrenia, or amount of medication prescribed. Differences in performances between different imaging techniques were examined.
Results
399 initial papers were whittled down to 38 studies with a total of 1,602 participants who met criteria for schizophrenia and 1,637 healthy controls. The data from these 38 studies was then entered into the analysis.
Sensitivity in this paper is the proportion of people that the screening test correctly identifies as meeting criteria for schizophrenia, expressed as a percentage. Specificity is the proportion of people the screening test correctly identifies as not meeting criteria for schizophrenia, expressed as a percentage.
To quote the paper:
Across all studies, neuroimaging-based classifiers separated SZ [schizophrenia] from HC {healthy controls} with a sensitivity of 80.3% (95% CI: 76.7 to 83.5%) and a specificity of 80.3% (95% CI: 76.9 to 83.3%).
In the secondary analysis, older patients demonstrated higher sensitivity; patients with a higher positive to negative symptom ratio had greater specificity; chronic schizophrenia participants had greater sensitivity than first episode participants and people on higher doses of antipsychotics had greater specificity than those on low doses. It may be that medication altered brain structure in people on it for longer or at higher doses making it easier for the test to differentiate participants with schizophrenia from healthy controls (Ho et al, 2011). Year of publication was not associated with significantly different performance.
There was overlap in confidence intervals of sensitivity and specificity but resting state functional MRI was superior to structural MRI in terms of sensitivity. Visual inspection of Forrest plots suggested publication bias was unlikely.
Conclusion
As an overall conclusion
-
80% of participants with schizophrenia and 80% of “healthy controls” were correctly identified as such, which means:
- 20% of participants with schizophrenia were incorrectly identified as being a “healthy control”
- 20% of participants without schizophrenia were incorrectly classified as having schizophrenia
Strengths and limitations
- This meta-analysis used a standardised and clear methodology to identify studies
- The perennial bugbear of meta-analysis: were they counting apples and oranges as the same? It’s not clear how different the types of multi-variate pattern recognition types were from each other. Using the Mark 1 Eyeball and looking at individual results, there was some heterogeneity of sensitivity and specificity
- The biggest weakness is use of different diagnostic criteria in different studies. This type of bivariate meta-analysis can only be done if the same diagnostic threshold and criteria are used in all studies (Takwoingi et al, 2015). Although there is likely to be significant overlap between patients diagnosed as having schizophrenia by related criteria such as DSM II, DSM IIR and DSM- IV, the amount of heterogeneity still makes a combined meta-analysis of diagnostic tests using different diagnostic criteria difficult to perform. It would be better to either use only the studies with a particular diagnostic criteria (e.g. DSM-IV) or perform separate meta-analysis for the different diagnostic criteria.
As in my last blog, I typed the figures from the study into www.clinicalutility.co.uk. Yet again it classified the usefulness of this type of biomarker as “Fair”. So even with clever algorithms and fancy dan brain imaging, I would suggest that this type of test is not ready for routine use. The lack of association of different performance with year of publication suggests that we may not see any improvement in performance of this technique in the future.
It looks like I don’t get to be a “proper doctor” and order diagnostic imaging scans for schizophrenia just yet.
Links
Primary paper
Kambeitz J, Kambeitz-Ilankovic L, Leucht S, Wood S, Davatzikos C, Malchow B, Falkai P, Koutsouleris N. Detecting neuroimaging biomarkers for schizophrenia: a meta-analysis of multivariate pattern recognition studies (PDF). Neuropsychopharmacology. 2015 Jun;40(7):1742-51. doi: 10.1038/npp.2015.22. Epub 2015 Jan 20.
Other references
Ho BC, Andreasen NC, Ziebell S, Pierson R, Magnotta V. Long-term antipsychotic treatment and brain volumes: a longitudinal study of first-episode schizophrenia. Arch Gen Psychiatry. 2011 Feb;68(2):128-37. doi: 10.1001/archgenpsychiatry.2010.199.
Sarpal DK, Argyelan M, Robinson DG, Szeszko PR, Karlsgodt KH, John M, Weissman N, Gallego JA, Kane JM, Lencz T, Malhotra AK. (2015) Baseline Striatal Functional Connectivity as a Predictor of Response to Antipsychotic Drug Treatment. Am J Psychiatry. 2015 Aug 28:appiajp201514121571. [Epub ahead of print]
Takwoingi Y, Riley RD, Deeks J. (2015) Meta-analysis of diagnostic accuracy studies in mental health. Evid Based Mental Health ebmental-2015-102228 Published Online First: 7 October 2015 doi:10.1136/eb-2015-102228
Photo credits


BibSonomy :: url :: Machine learning algorithm: future of diagnosing schizophrenia?
10 years agoivomarbrito
10 years agobrainpan2015
10 years agoDrS_Reynolds
10 years agoNeurolawGuy
10 years agoRobinHadley1
10 years agolornasfraser
10 years agoSelinaNath
10 years agomatteo_brainnet
10 years agomatthewrbroome
10 years agoRelearnML
10 years agostefpbrug
10 years agoBrianG61UK
10 years agoSenchiLab
10 years agoSameiHuda
10 years agoSCIE_sco
10 years agomorriseric
10 years agoChris Ball
10 years agoLia Ashlin
10 years agodopaminergic13
10 years agoMental_Elf
10 years agojongepsychiater
10 years agohomeAIinfo
10 years agohomeAInews
10 years agoBrain__Hacking
10 years agoKarenSykes2
10 years agoAmy Swartz Kerr
10 years agoLibrary014
10 years agoFirefly_fan
10 years ago121Therapy
10 years agoMental_Elf
10 years agoClaire Bear Robertson
10 years agoPaulette Howard
10 years agoeSaludMental
10 years agoPowysTHBLibrary
10 years agoHealth_News4U
10 years agoJoe McCleery
10 years agoSameiHuda
10 years agoMental_Elf
10 years agoHampshire Healthcare Library Service
10 years agoChristina Armstrong-Graham
10 years agoThe Mental Elf
10 years agoJHOconsult
10 years agoIOWNHSLibrary
10 years agoDrIanDawe
10 years agoKatie1Peterson
10 years agokresimirr
10 years agoCarina Kirby
10 years agoMicbrend
10 years agoBernard Carroll
10 years agohomeAInews
10 years agomathiaspicker
10 years agoSameiHuda
10 years agoMental_Elf
10 years agoLOVEnver_fails
10 years agoRasha Hosni Ali
10 years agomsebastian_psi
10 years agoDrBrocktagon
10 years agobdeako
10 years agoInnenwelttramp
10 years agotheICCLondon
10 years agodeevybee
10 years agokirstie_j
10 years agonyonenyone
10 years ago121Therapy
10 years agohomeAInews
10 years agoTheAstroduck
10 years agopsychtutoring
10 years agoSameiHuda
10 years agoDorothy Bishop
10 years agoTAWOP
10 years agoSameiHuda
10 years agoSameiHuda
10 years agofacebookguide2
10 years agoattaitch
10 years agoiVivekMisra
10 years agoFormerHermit
10 years agoIntl_Nurses
10 years agoiahcp
10 years ago