The identification of individuals at risk of caries allows the application of measures to reduce their risk and thus reduce the prevalence or severity of caries. Usually, the aim is to prevent lesions from cavitation, at which point the loss of minerals from the tooth is irreversible and usually requires restorative treatment.
The development of a predictive model requires establishing how good the model is at identifying between individuals with increments of caries and those without increments (discrimination) and is evaluated by the model’s ability to correctly classify individuals according to their level of risk. It is measured by the area under the curve (AUC). The agreement between the predicted and observed risk of caries increment in the follow-up (calibration) and is assessed by the ratio of observed at risk versus expected at risk (O:E ratio). A value of 1 indicates an optimal model, while values >1 indicate a model that underestimates risk and <1 indicates a model that overestimates risk.
Several caries risk assessment (CRA) models have been developed and the aim of this systematic review is to assess the predictive performance of CRA models for the prediction of caries increment for individuals.
Methods
Searches were conducted in PubMed, Embase, and CINAHL databases. To assess the predictive power, cohort studies were included. Studies in a language other than English were excluded. The risk of bias was assessed using the Prediction model Risk Of Bias ASsessment Tool (PROBAST). The data extraction was performed by one reviewer using the Critical Appraisal and Data Extraction for Systematic Reviews of Prediction Modelling Studies (CHARMS) checklist. Model performance was the ability to discriminate (AUC) and calibration (O:E ratio). These measures were compared using a random-effects model meta-analysis. Meta-analyses were performed for each predictive model separately and subanalyses were performed according to the risk of bias.
Results
- 3506 studies were identified of which 482 were screened and 22 studies were included.
- The studies reported on seven risk models:
- three quantitative models (Cariogram, NUS-CRA y Dentoprog Method) and 4 qualitative models (CAMBRA, CAT, PDS y UMSDA-CRA).
- Four models had both a full and a reduced version: CAMBRA, CAMBRA, NUS-CRA y CAT.
Characteristics of the models included
- Cariogram
- Predictors/indicators: The reduced model includes caries experience, related general diseases, diet frequency, plaque amount, and fluoride programme. The full model includes additional biological variables including saliva secretion rate, saliva buffering capacity, LB count and MS count are excluded in the reduced model.
- Method of assessment: Algorithm (quantitative)
- Risk prediction: Very low (0-20% chance), low (20-40% chance), moderate (40-60% chance), high (60-80% chance), and very high (80-100% chance).
- CAMBRA: Caries Management By Risk Assessment
- Predictors/indicators: The reduced model includes multiple indicators which can be classified into disease indicators (such as white spots on smooth surfaces), risk factors (such as visible heavy plaque on teeth), and protective factors (such as the use of fluoride). The full model includes additional biological indicators including saliva flow rate, MS count, and LB count. The indicators in the model for children aged > 6 year and adults are somewhat different from the indicators for children aged <6 years.
- Method of assessment: Reasoning from the manual charting/checklist (qualitative)
- Risk prediction: Low, moderate high, and extremely high.
- NUS-CRA: National University of Singapore Caries Risk Assessment
- Predictors/indicators: The reduce model includes social/biological risk indicators (such as parents` low socioeconomic status and parents` active dental caries), protective indicators (such as teeth brushing daily with fluoridated toothpaste), and clinical findings (such as child has >1 decayed/missing/filled surfaces and child has active white spot lesions or enamel defects). The full model includes additional indicators in clinical findings including salivary flow and MS levels. The indicators in the model for children aged ≥6 years are somewhat different from the indicators for children aged <6 years.
- Method of assessment: Reasoning from the manual charting/checklist (qualitative)
- Risk prediction: Low, moderate, and high.
- CAT (Caries-risk Assessment Tool)
- Predictors/indicators: The reduced model includes the indicators on age, ethnicity, father`s education level, infant feeding, diet, fluoride, dental attendance, parents` knowledge on dental care and caries, number of decayed teeth, past caries, general health, plaque index and average pH. The full model includes additional biological variables including SM and LB counts.
- Method of assessment: Algorithm (quantitative)
- Risk prediction: Very low (0-20% chance), low (20-40% chance), moderate (40-60% chance), high (60-80% chance), and very high (80-100% chance).
- PDS (Public Dental Service)
- Predictors/indicators: Multiple indicators on caries (such as progression of lesion in last 2 years), periodontal health (such as bleeding pocket and bone loss), general health (such as medication), and technical problems (such as restoration with risk of fracture).
- Method of assessment: Reasoning from the manual charting/checklist (qualitative)
- Risk prediction: Low, some, high, and very high.
- DentoProf-Method
- Predictors/indicators: Three predictors including the number of sound primary molars, number of discoloured pits and fissures of permanent first molars, and number of buccal and lingual smooth surface of permanent first molars with white spots
- Method of assessment: Algorithm (quantitative)
- Risk prediction: Continuous
- UMSD-CRA University of Michigan School of Dentistry Caries Risk Assessment model
- Predictors/indicators: Multiple risk factors on stagnant plaque in caries-susceptible sites, saliva-related risk factors, diet-related risk factors, inadequate protective modifying factors, conditions that affect compliance and signs of caries experience.
- Method of assessment: Reasoning from the manual charting/checklist (qualitative)
- Risk prediction: Low, moderate, and high.
- They found five studies with low risk of bias, all about CARIOGRAM, and the rest of the studies had high risk of bias.
| Discrimination | Calibration | |||
| No. of Studies | AUC | No. of Studies | O:E ratio | |
| Cariogram (full) | 5 | 0.78 (95%CI: 0.68 to 0.85) | 12 | 0.91 (95%CI: 0.72 to 1.14) |
| Cariogram (reduced) | 6 | 0.72 (95%CI: 0.67 to 0.77) | 6 | 0.84 (95%CI: 0.59 to 1.18) |
| CAMBRA (full) | 3 | 0.62 (95%CI: 0.32 to 0.85) | 5 | 0.83 (95%CI: 0.54 to 1.28) |
| CAMBRA (reduced) | – | – | 1 | 0.52 (95%CI: 0.47 to 0.59) |
Conclusions
The authors concluded :-
Both full and reduced Cariogram are found to be reasonably reliable tools for the prediction of caries in individuals in clinical practices and communities. The reduced Cariogram shows slightly better performance and poses less burden in terms of time and resources to individuals than the full Cariogram.
The evidence on the predictive performance of the other CRA models is limited so far due to the insufficient number of high-quality studies included.
Comments
The result of this systematic review supports the use of cariogenic risk assessment and finds that one tool, the Cariogram, has evidence to identify individuals at risk. Considering that the reduced version of the Cariogram requires less clinical time and has a similar performance to the full version, its use would be recommended in the clinic.
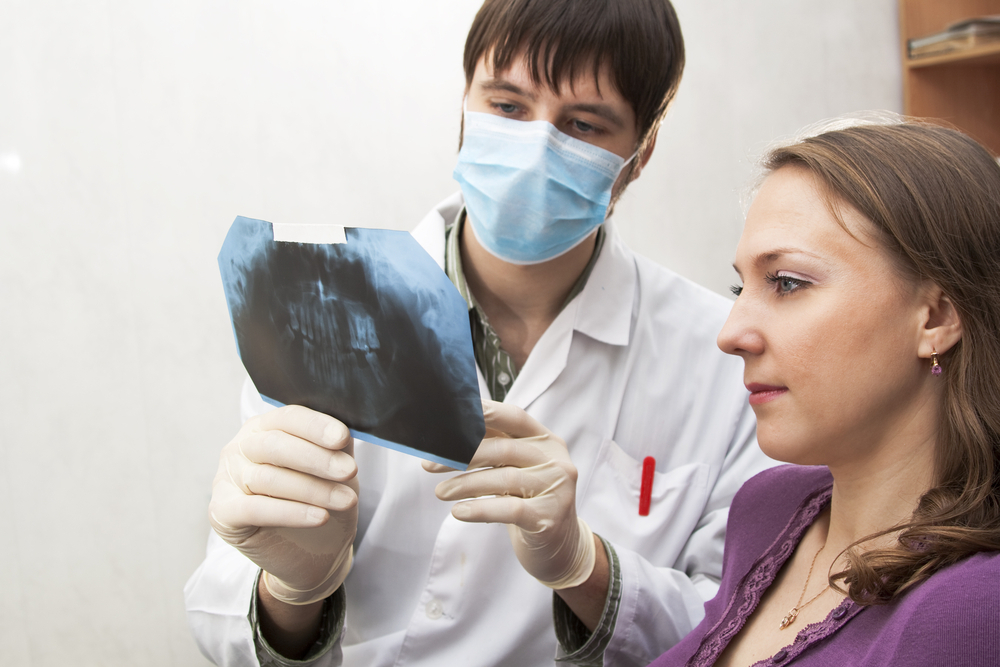
From the clinical point of view, the CRA is an essential step in the patient’s examination. The results of the CRA guide the clinician to order additional tests in high-risk patients, such as X-rays. The Cariogram version can be downloaded for Windows and Mac from the University of Malmo website at https://mau.se/om-oss/fakulteter-och-institutioner/odontologiska-fakulteten/sektioner-content-grid/sektion-3/#accordion-64635 .
Caries risk assessment, and risk assessment in general, is not so much about accurately predicting a future adverse event, but about reporting that risk in order to avoid it. Thus, a good risk assessment leads to the absence of the event, which is difficult to prove. Also, prediction models are designed to assist healthcare professionals and patients with decisions about the use of diagnostic testing, starting or stopping treatments, or making lifestyle changes.
The systematic review report is complete and detailed. The paper does not address the problem of what to do with the outcome of the risk communication to the patient. In dentistry, there are no studies to date, but in medicine, the available systematic reviews indicate that risk communication to the patient has virtually no effect on changing patient behaviour or attitudes (French et al. 2017). Finally, to read and critically appraise the literature on the topic, it is appropriate to consider the available guidelines, such as Van Carlster et al. (2019)
Links
Primary paper
Su N, Lagerweij MD and van der Heijden GJMG (2021) Assessment of predictive performance of caries risk assessment models based on a systematic review and meta-analysis. Journal of dentistry 110: 103664. https://doi.org/10.1016/j.jdent.2021.103664
Other references
French DP, Cameron E, Benton JS, Deaton C, Harvie M. (2017) Can Communicating Personalised Disease Risk Promote Healthy Behaviour Change? A Systematic Review of Systematic Reviews. Ann Behav Med. 2017 51(5):718–29.
Van Calster B, McLernon DJ, van Smeden M, Wynants L, Steyerberg EW. (2019) Evaluating diagnostic tests and prediction models of the STRATOS initiative. Calibration: the Achilles heel of predictive analytics. BMC Med. 2019 Dec 16;17(1):230.
The Dental Elf – 12th Nov 2015
Caries risk assessment – limited evidence to support current methods
The Dental Elf – 28th Aug 2018
The Dental Elf -21st Jan 2019